What you will learn in this section
- How predicted scores are generated in a decision tree for:
- Classification Tree Model
- Regression Tree Model
In our previous discussion, we provided a brief overview of how a decision tree is constructed by selecting and splitting variables. Before diving into the details of how variables are chosen and split thresholds are determined, let's first understand how a decision tree makes predictions for given data points.
Predictions in a Classification Tree
In classification trees, we determine predictions by counting the number of data points belonging to each class (e.g., positive and negative). The probability of a data point belonging to the positive class is calculated by dividing the number of positive class points by the total number of points in that region.Below is the classification decision tree that we discussed in the previous section.
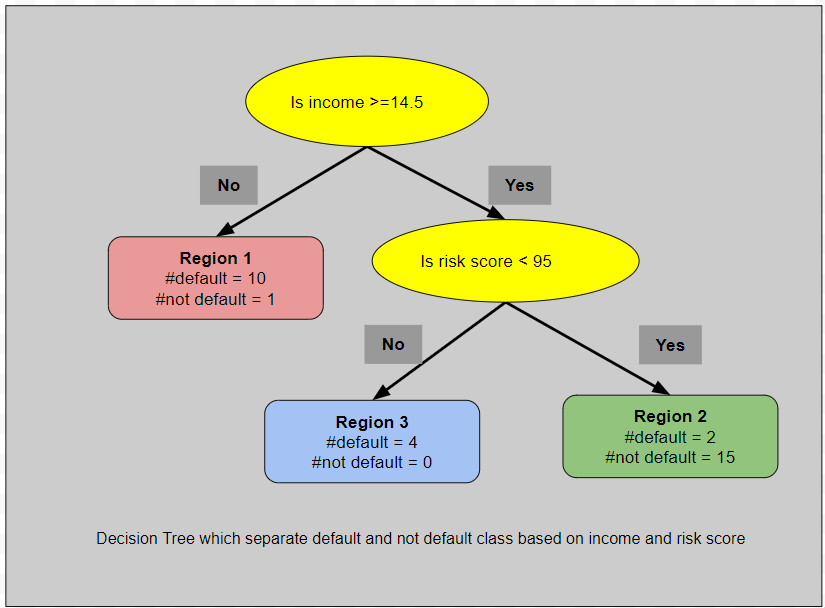
Region 1
- Count of defaults: 10
- Count of non-defaults: 1
- Total count: 11
- Predicted probability of default: 10/11 = 0.909
This region has a very high probability of default.
Region 3
- Count of defaults: 4
- Count of non-defaults: 0
- Total count: 4
- Predicted probability of default: 4/4 = 1
This region has the highest probability of default.
Region 2
- Count of defaults: 2
- Count of non-defaults: 15
- Total count: 17
- Predicted probability of default: 2/17 = 0.117
This region has a very low probability of default.